Attempt to understand the US coronavirus situation
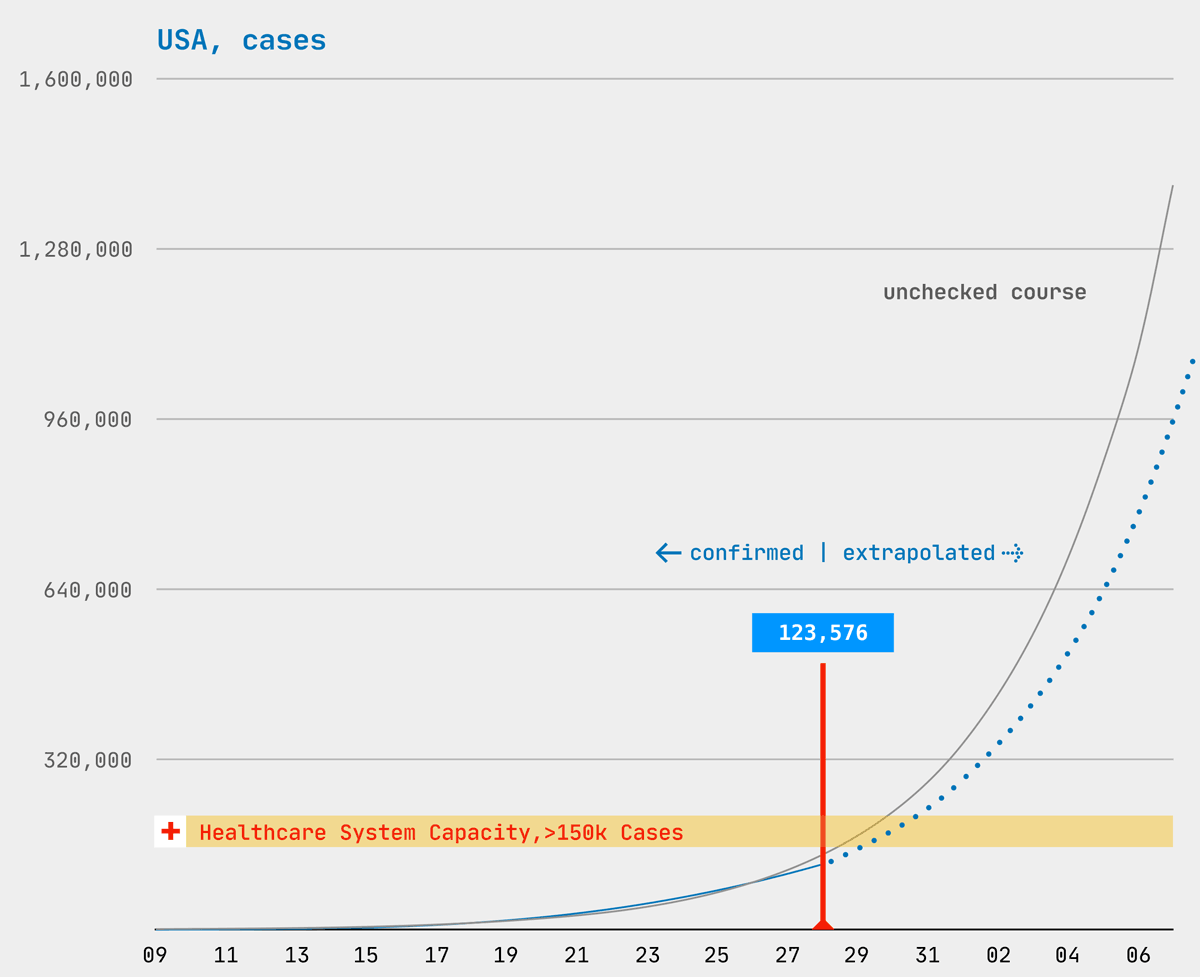
Yesterday’s coronavirus curves for USA, predicted cases vs. confirmed cases, March 28, 2020
The number of infected people in the USA is exploding almost unchecked: with 123k registered cases today, Sunday morning, they are 30k higher than in Italy and 42k higher than in China. My mathematical model, which I built for the observation in Germany, does not work for the US numbers. So I have rebalanced it, like a bathroom scale that is suddenly to be used for weighing an apple harvest weighing tons.
The general conditions in the countries that are currently very strongly affected by corona – USA, Italy, China, Germany, Spain, Iran and France – differ extremely. There are a handful of variables, some of which are unknown or cannot even be put into figures:
• Start of the epidemic (first case detected)
• Age structure (demography)
• The tests (when, how much, who is tested)
• Quality of healthcare (see also Fontblog: Some Interactive Coronavirus Maps
• Politics
We know from the media that the relative number of tests in the USA is lower than in Germany … which leads to a computationally high death rate (too few registered cases vs. very precisely registered deaths). Experts also believe that the reaction of US politics to the crisis came too late and that the president’s zigzagging course exacerbates the situation. In some regions, for example New York, the health care system has already reached its limits.
To adjust my table to US conditions, I have readjusted the first column. It shows the unchecked development of corona infections, as it can be calculated from international observations in the last months: doubling of cases every 3 days. Here it is important to know that the number of registered cases of course does NOT reflect the number of infected persons, because not the whole population is tested every 3 days, but rather a sample value, which nevertheless results in a relative growth trend, and is therefore suitable as a basis for political decisions.
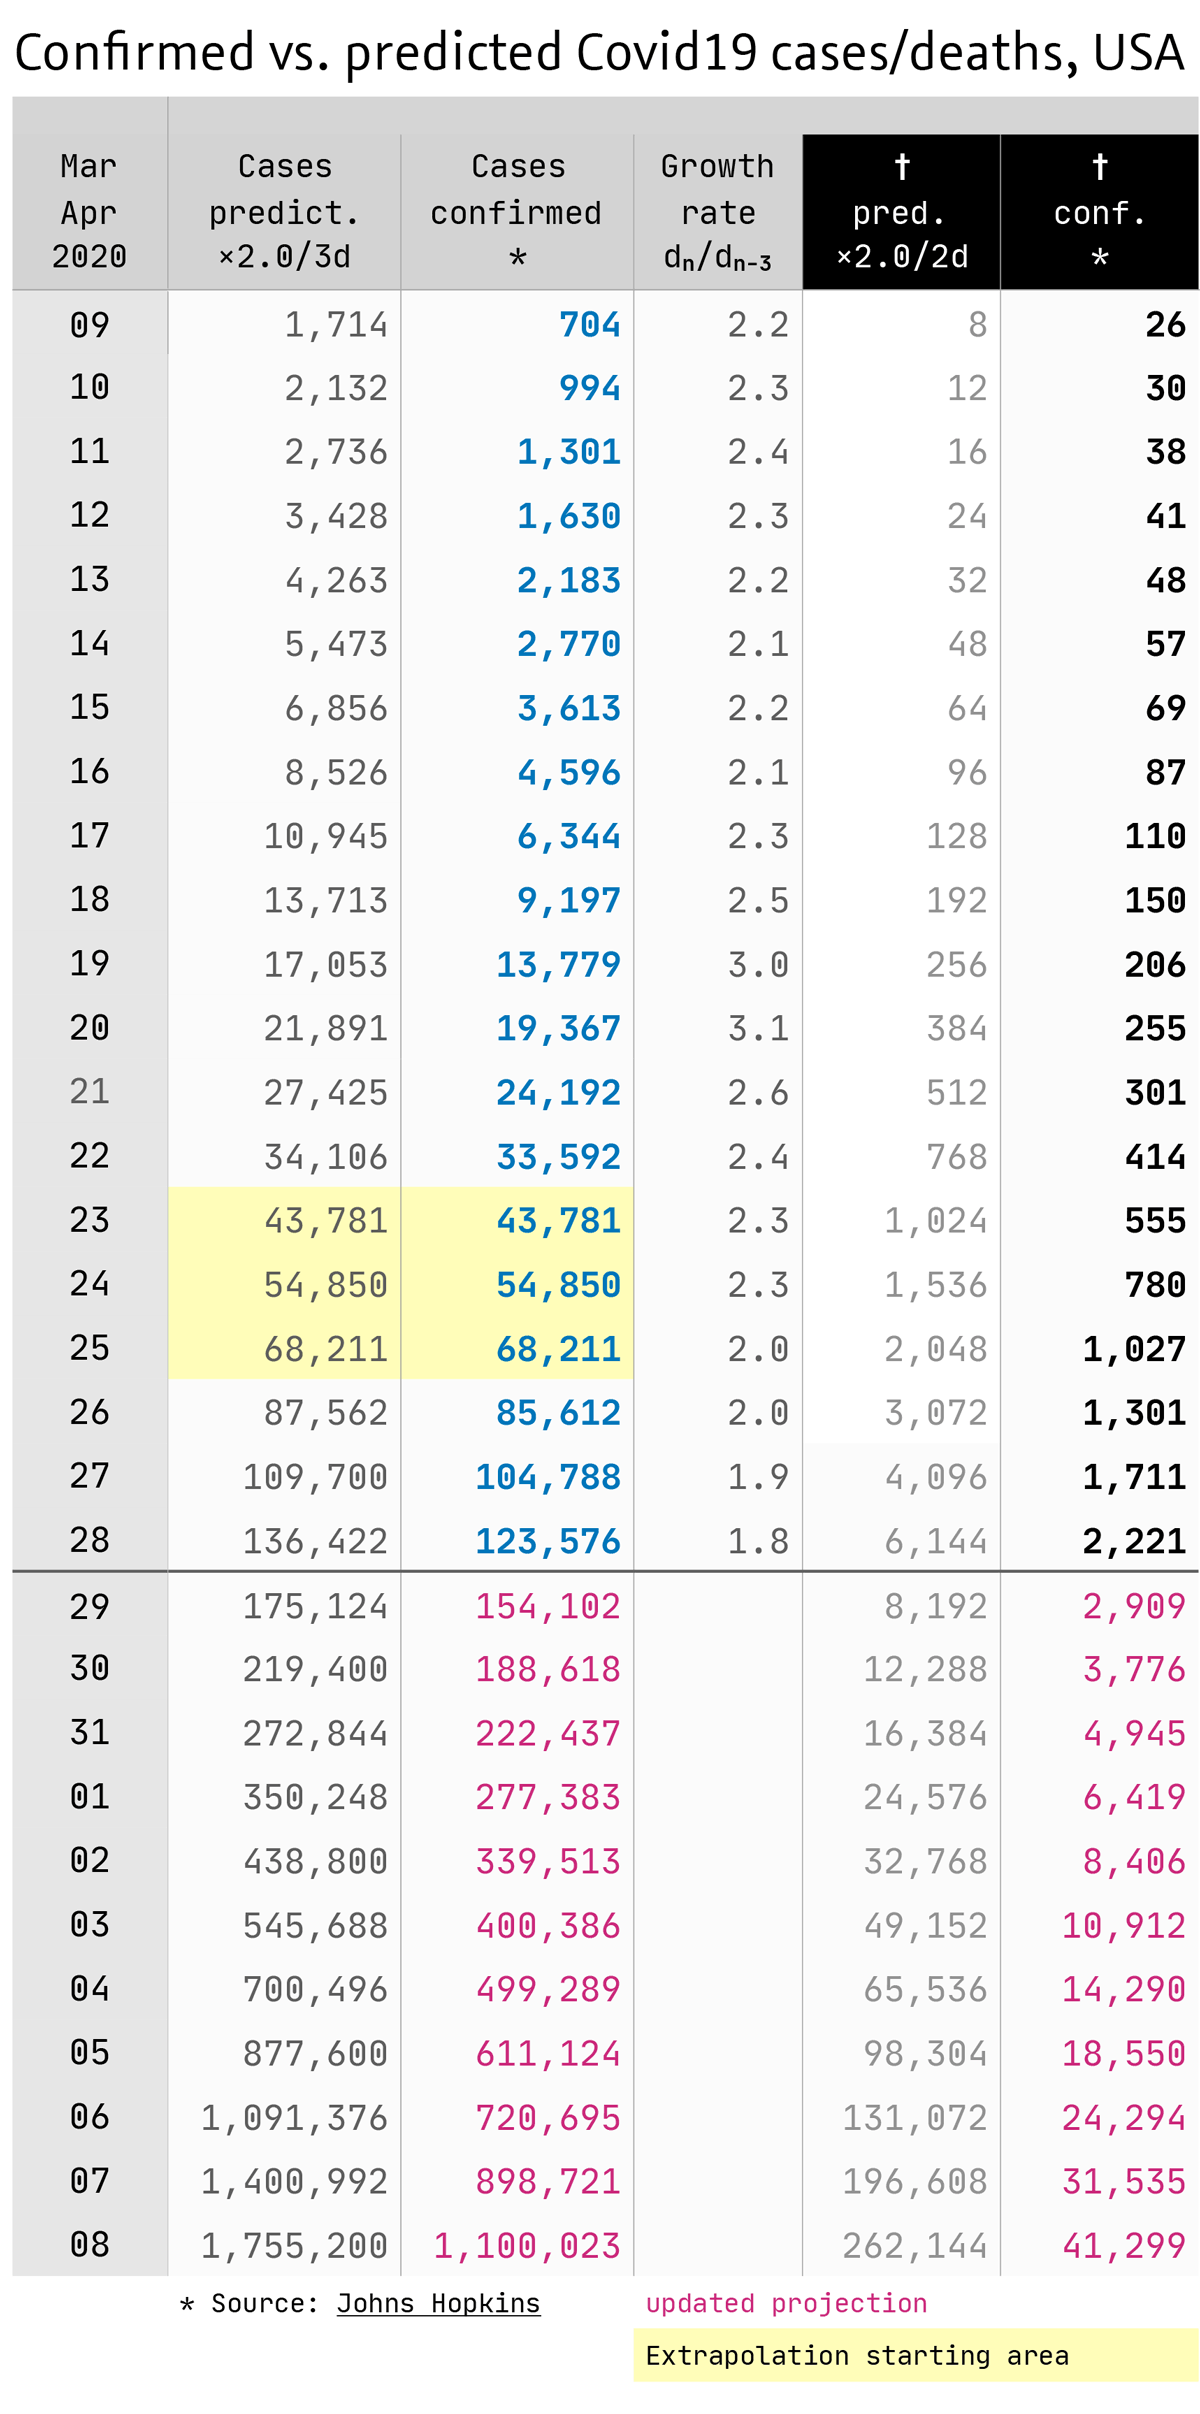
Yesterday’s coronavirus spreadsheet: registered Cases and Deaths in the USA
Assuming that the amount of testing in the US has been ramped up day by day since the beginning of March and that it is quite resilient, I have normalized my first column to the first 3 days of last week, i.e. March 23-25. You can see from the yellow highlighted fields that they show the same values in column 1 and 2: theory and practice are put on the same level. Starting from these three days, I extrapolated the projections of the first column into the past and into the future … i.e. I stretched the doublings per 3 days in the table up and down.
In retrospect, on some days the unreal moment arises that the number of registered cases is higher than the actual spreading speed of the coronavirus … which is simply because more tests were carried out and for this reason alone, the number of registrations increased. However, it is much more important to look into the future, i.e. the question: is there a gap between projected cases and actual cases? Or, to put it another way: are the measures ordered by politicians taking effect?
The good news is that the growth rate of registered cases is also declining in the US, from 2.0 in the last 3 days, to 1.9 and yesterday to 1.8. Considering that the amount of testing continues to increase, the deceleration of infections could even be below 1.8.
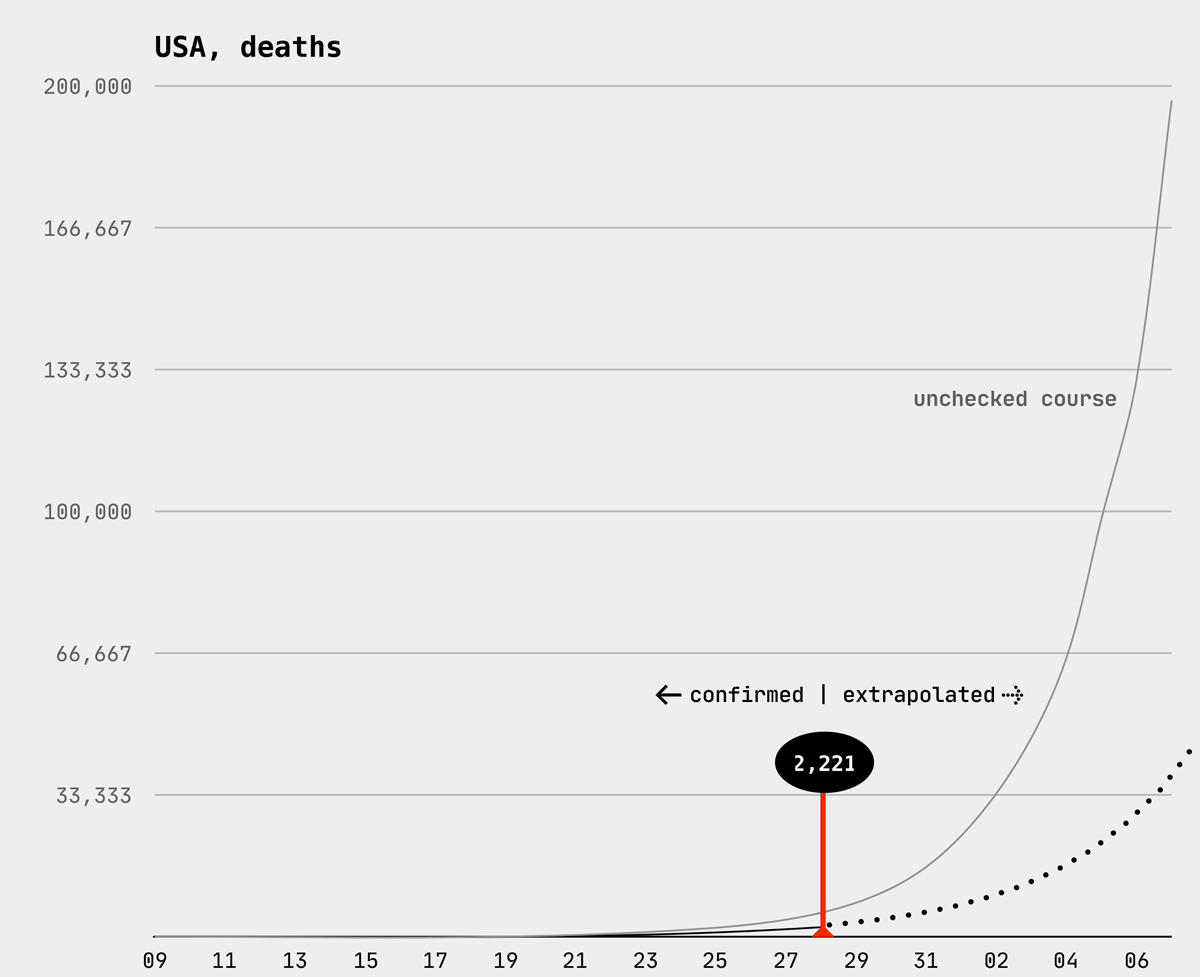
Yesterday’s coronavirus curves for US, predicted deaths vs. confirmed deaths, March 28, 2020
The trend in deaths in the US is similar to that in Germany, but with a growth rate of 1.7 it is two tenths higher than in Germany (1.5).
Author’s note: The above values are purely speculative estimations using simple mathematical modelling (based on registered cases/deaths) and are not confirmed by health authorities nor any other national public authority.
<em>kursiv</em> <strong>fett</strong> <blockquote>Zitat</blockquote>
<a href="http://www…">Link</a> <img src="http://bildadresse.jpg">